
Uber’s Surge Pricing a Study in Important Investment Topic: Consumer Surplus
Posted by Jason Apollo Voss on Jan 27, 2014 in Blog | 0 commentsUber, the San Francisco–based start-up whose mobile app allows people to hail taxis on their smartphones, has had its fair share of bad press lately. (See: “Is Uber’s Surge-Pricing an Example of High-Tech Gouging?” and “Taxi Drivers Turn Violent against Uber in Paris.”) At the heart of the issue is something known as “surge pricing.”
Without commenting on the merits of Uber’s specific business plan or about the ethics of its economics, its story provides a case study in an important investment topic: the consumer surplus.
What Is Surge Pricing?
Those tracking the Uber story know that the company’s business model is to charge higher prices for taxi rides during peak taxi demand times. Taxi riders wanting to assure themselves of a ride in inclement weather or after the end of a sporting event can be assured of a cab if they are willing to pay up for the privilege. This pricing is known as surge pricing and is accepted by consumers in other venues, such as airline tickets. However, surge pricing for taxis is a new application, and many consumers and consumer rights groups are upset about the company’s unique pricing model. But, put in economics terms, Uber’s business model is simply capturing the consumer surplus.
What Is the Consumer Surplus?
Here’s an example that will make the consumer surplus easier to understand. Imagine you don’t own any shoes but have to commute to work. How much would you pay to rent a pair of shoes for the day, when your alternative is to go barefoot?
I have done this exercise with dozens of people over the years and most answer in the $2–$10 range. Now, if you had to do this each day for a full year (around 270 work days), you would have spent around $540 to $2,700 for the privilege of wearing shoes (depending on your perceived value for shoe wearing). Yet, most of us wear shoes that cost much less than $540–$2,700, usually in the $100–$150 range.
Consumer surplus is the difference between what you would be willing to pay based on your perceived value for a product and what you actually pay. In the shoe example, the consumer surplus ranges between $390 ($540–$150) to $2,600 ($2,700–$100). Graphically, the consumer surplus is shown as:
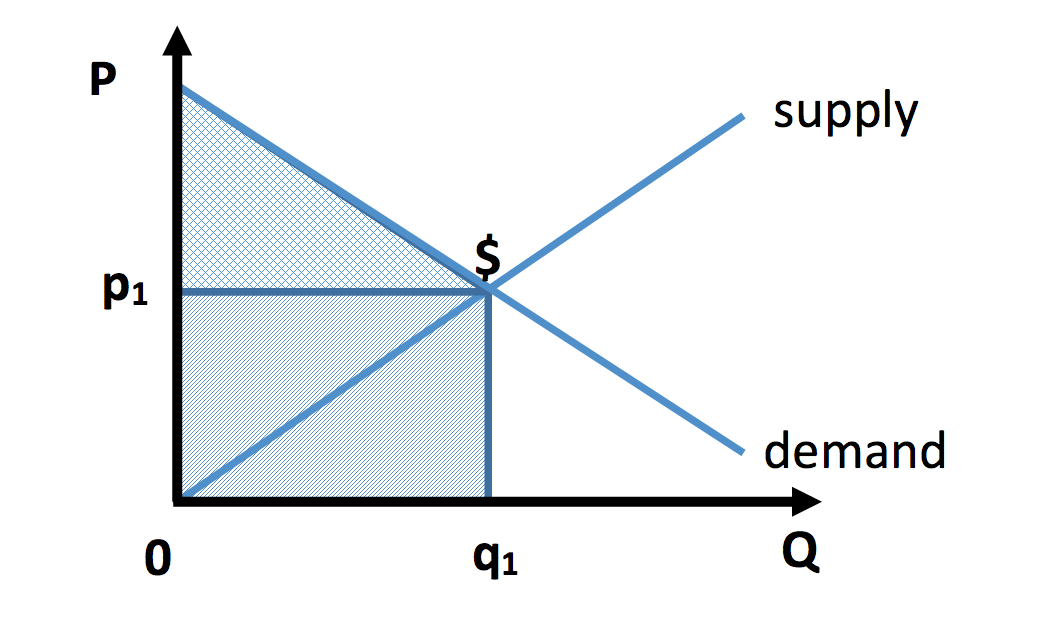
In the above graph:
P = price of a good
Q = quantity of a good
p1 = market clearing price for the good
q1 = market clearing quantity for the good
The shaded box framed by p1 − 0 − q1 − $ is the amount paid by consumers for the good, and hence captured by suppliers of the good. Yet if you look at the triangle framed by P − p1 − $, you can see that some consumers were willing to pay much more for the good (almost double, in fact); this crosshatched region is the consumer surplus.
Why Is the Consumer Surplus an Important Investment Topic?
Free money exists for businesses that can find a way to capture the consumer surplus. Why? Because the costs of production only go down when more quantity of a good is produced, yet the price charged for the same good goes up. Think: Starbuck’s charging $4 for a cup of coffee that previously sold for only $1.
This is not an endorsement for Uber, but it has found a way to charge more for the same good, a taxi ride, at different times and for different consumers. Only the market, including consumer preferences, will determine whether or not it is successful in the long run. But as an investor, it behooves you to identify companies that have found ways to capture a higher proportion of the consumer surplus.
Photo credit: ©iStockphoto.com/ChrisSteer
Originally published on CFA Institute’s Enterprising Investor.